BITCOIN POWER CONSUMPTION.INFO
  • Home
  • Breakdown
  • J/THash
  • Climate
  • Water use
  • ESG
  • eWaste
  • Demand/response
  • Banking

World Bitcoin mining average ASIC efficiency

Bitcoin ASIC mining average is ≈ 15.2 J/TH (January 2026)

   Here are few methods to calculate world average J/TH. If we know this figure, a quick calculation gives us Total World Bitcoin mining power.

Calculate J/THash - Method A


​Power =
 World hash rate x Average J/TH

   The green column is advertised efficiency measured in Joules per TeraHash JTH, most efficient at the top.
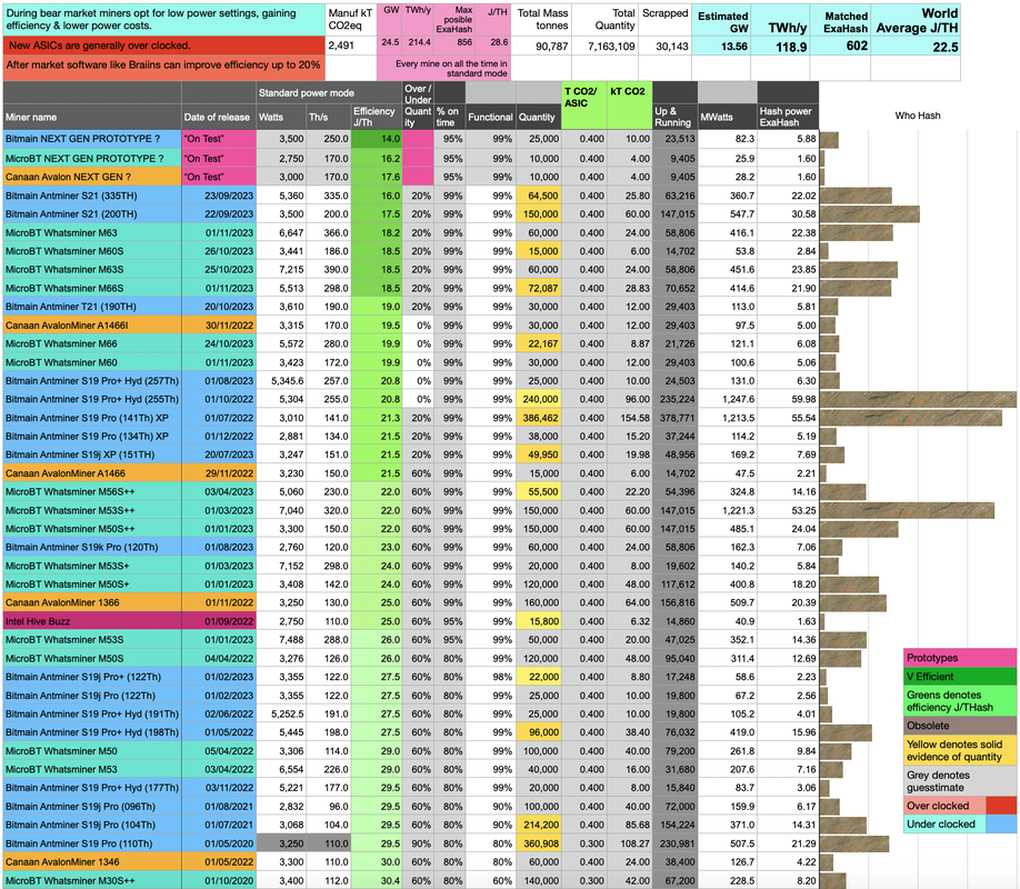
​   This spread sheet calculates -

  • Bitcoin world average mining efficiency in J/TH (Joules per TeraHash) {top right light blue}.
  • World total bitcoin ASICs ever produced
  • Total mass of all ASICs ever produced
  • Total mass of scrapped ASICs
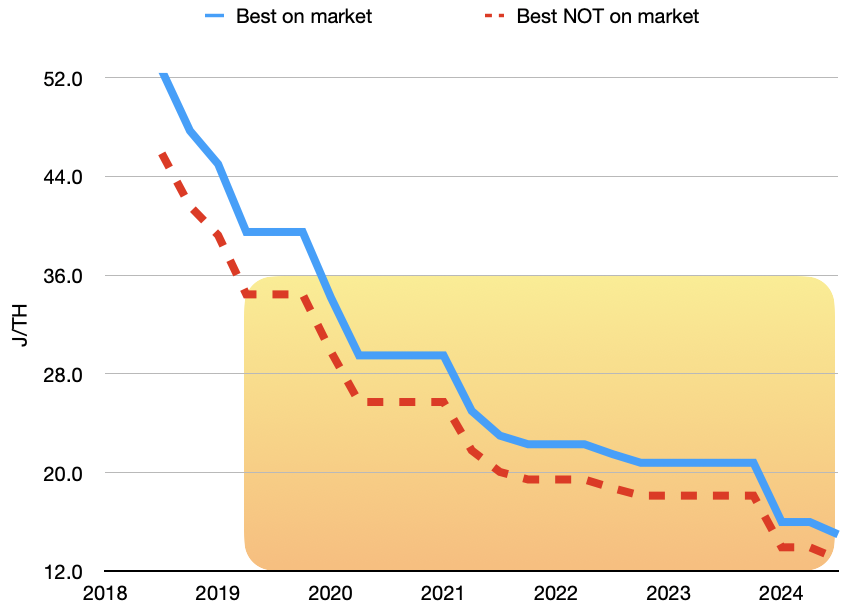
Mining equipment performance improvements-
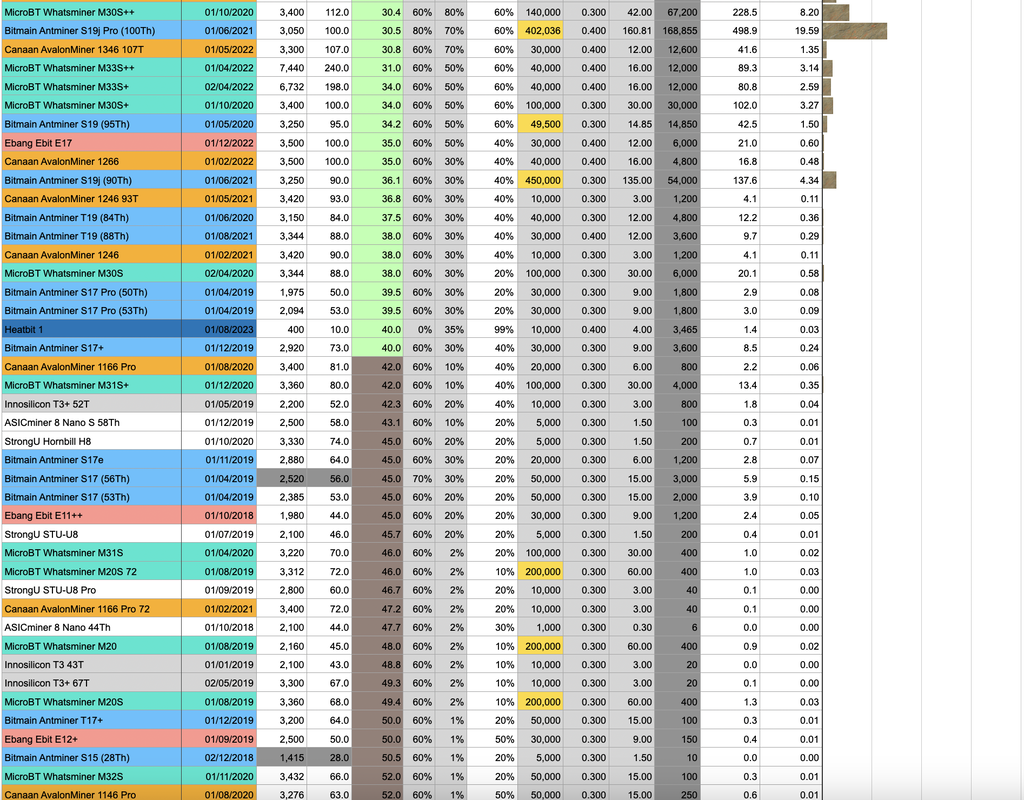
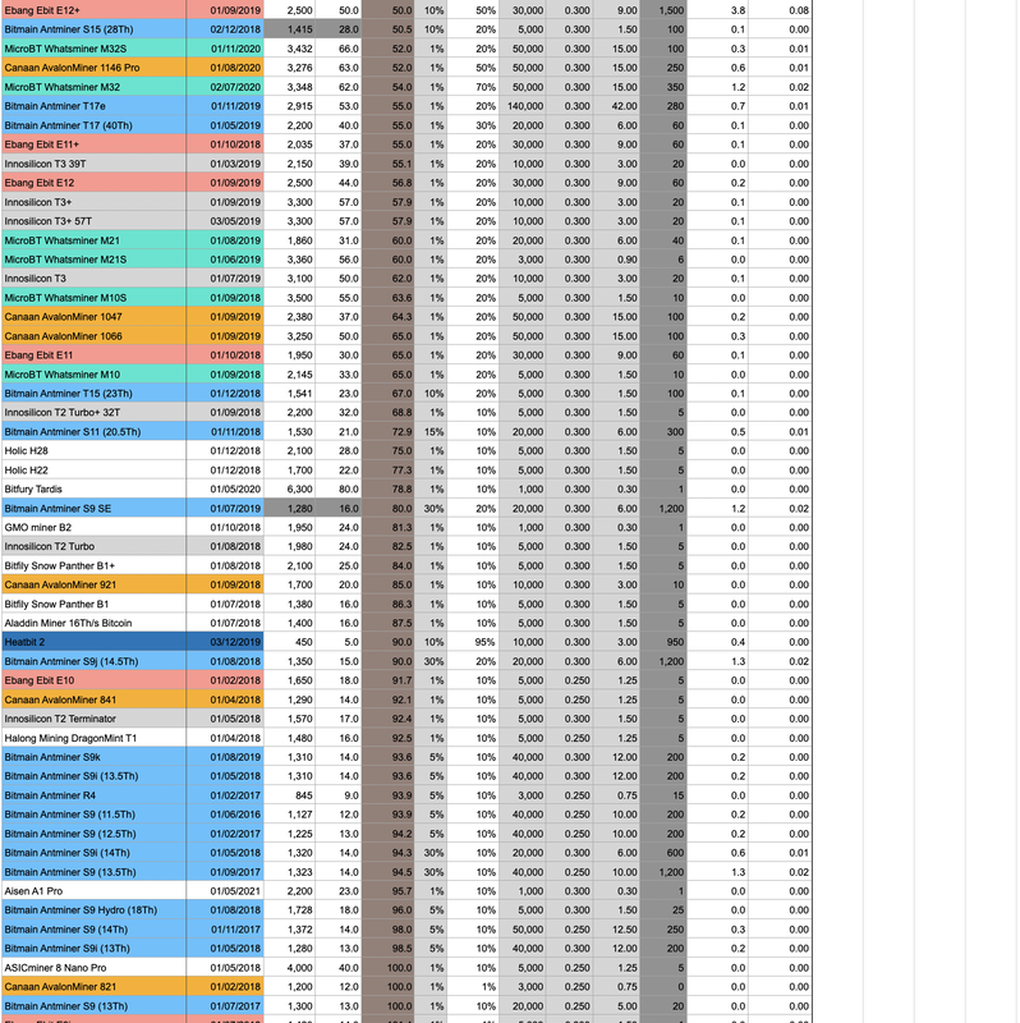
  • Amazing performance     < 9.5 J/TH yet to be released may be being "tested" by the manufacturers
  • Newly released             9.5 - 18 J/TH
  • Older less profitable    18 - 30 J/TH
  • Obsolete                        30 - 80 J/TH
  • Really Old Junk           80 - 765 J/TH
Picture

Key factors

  • ASIC Efficiency
  • Power consumption
  • ASIC Power Mode (High Medium Low)
  • After market software such as Braiins can increase efficiency by up to 30%
  • Immersion mining can increase efficiency by up to 25% or allow to be over clocked
  • Quantity produced - Mostly educated guess but quantities highlighted in yellow have solid evidence (links below)
  • Functional percentage - As mines get older they wear out.
  • UP time - 10,000 brand new mines in an industrial mining unit would have much more up time say 98% than an amateur using a 5 year old ASIC only for heating for 30% of the year
Miners can then alter the software and or use immersion mining methods to improve efficiency or increase Hash rate.
   Many miners will just run them standard, others miners may over clock them in an attempt to get a quick return on investment or run them slow & efficient to lower power costs.
​
   Functioning quantities & up time etc are then tweaked to match the World hash rate. The world Average J/TH can then be calculated & thus Bitcoins overall power consumption.

Quantities

   Finding how many of - which model have been sold / are still in operation is tricky. In an ever changing picture occasionally we get glimpses of sales in the 10-100s of thousands of units (Yellow highlight).
​   Quantity , Model & J/TH Links to sources below.
  • Trump 16,290  Antminer U3S21EX
  • Cleanspark 26,000 Bitmain-s21-xp
  • Bitfarms 28,000 T21
  • www.sec.gov/Riot 48,058 M66s
  • CleanSpark-up-to-160,000-S21-Miners April-June
  • Cleanspark 22,000 S21 17.5JTH January 2024
  • Iris 7,000 S21 17.5JTH
  • Terawulf 18,500 S19j XP 21.5J/TH
  • ​Riotplatforms 33280 MS56++ &MS56+
  • Cleanspark 45,000 S19 XP 21J/THash
  • Cleanspark 12,500 S19 XP 21J/THash
  • merklestandard Bitmain 26.4 J/TH
  • ​​Poolin & Bitmain 47,000 HYD 198 29.5 J/THash
  • ​Marathon 78,000 S19 XP 140T 21 J/THash
  • Marathon efficiency improvements
  • Terawulf 15,000 S19 XP
  • Riot 18,000 S19 XP 140T 21 J/THash
  • Bitfarms 1,500 S19 XP 140T 21 J/THash
  • Fortress 600 S19 XP 140T 21 J/THash
  • Marathon 30,000 S19j 100T 30.5 J/THash
  • ​MicroBT 600,000 M20 46-49.4 J/THash
  • Cleanspark 20,000 S19j pro+ 27.5 J/TH

Calculate J/THash - Method B

   Serious miners are only going to use the most recent/ efficient mining ASICs (usually from Bitmain), so to ascertain the all important J/TH figure its fairly easy to look at the graph & estimate the average for the last 3 or 4 years. Also bear in mind there will probably be a few warehouses full of next generation mining equipment, not on the market but "on test" (dotted green line).
Picture

Calculate J/THash - Method C


   Some mining companies straight up tell you the all important average Fleet Efficiency in J/TH .
Power =  J/TH x Hash rate
gives us the Power being consumed assuming all mining outfits are averaging around this figure.
  • Iren mining 15 J/TH
  • Cleanspark 16.07J/TH "Peak efficiency of deployed has rate"
  • Bitfarms 17W/TH efficiency
  • Terawulf 18J/TH Operating efficiency
  • Mara.com 19J/TH
  • Antpool 17 J/TH
  • Riot 18. J/TH5  February 2025    (18.5 x 800,000,000TH = 14.8 GW)
  • Marathon 19.3 J/TH 2025   (20 x 800,000,000TH = 16 GW)


   Others announce their hash rate & power consumption. A quick calculation gives us their average Joules per THash, this is likely to be inaccurate because they may like to brag "we have 100MW of infrastructure" but may only be using 60MW, or "we have 5 ExaHash" but only have 3 switched on. This gives clues to the big mining companies efficiency. Some companies execute Demand Response, they would obviously curtail their most inefficient machines first resulting in greater overall efficiency.

​Disproving other wild energy claims

United Nations University Study

​United Nations University claim -
"In the 2020-2021 period, the global BTC mining network devoured 173 terawatt-hours (TWh) of electricity, “
​Claimed Power consumption = 173 TWh/year
Hours a year = 8766
Watts = 19.7 GW
World Hash (2020-2021)= 125,000,000TH/s
​173,000GWh / 8766 = 19.7 GW
19,700,000,000W / 125,000,000TH =
​158 W/TH = ❌ Incorrect

   As we can see from the best on market graph, during 2020-2021 the best on market to would be 32 W/TH and the only just economically viable would be around 96 W/TH, so the average would be somewhere in between.

   The deceptive report constantly compares compares apples to bananas, and in a staggeringly unscientific way neglects to make it clear that "2020 - 2021 period" actually means a 2 full years energy and emissions. A bit like saying my car does 123 miles per 2 gallons 🙄
   Also debunked by Margot Paez at the Bitcoin policy institute

Cambridge

   One of the most widely quoted estimates from Cambridge University. They take a bit of a shot gun approach quoting Low - Medium - High estimates ranging from 57 - 120 - 196 TWh per year which straight away tells me they don’t really know. However we shall do the maths for the middle estimate.
​Claimed Power consumption = 120 TWh/year
Hours a year = 8766
Watts = 13.7 GW
World Hash = 300,000,000TH/s
​120,000GWh / 8766 = 13.7 GW
13,700,000,000W / 300,000,000TH =
​45 J/TH = ❌ Incorrect

   If we refer back to the spreadsheet’s efficiency column (green shades) we can see this level of ASIC operating efficiency is at best so so, with the vast majority of hash rate way above this. In fact 45 J/TH is now so far down the green column it's now in the brown area.

(these calculations are accurate for the claimed values at the time of Cambridge's publication - February  2023 )

Alex de Vries - Digiconomist

   In 2020 the widely quoted & practically the only thing you are allowed to find on the internet Alex de Vries claimed 
205 TWh/year (or 205,000 GWh). His discredited calculations take no account of CAPEX (CAPital EXpenditure). ASICs & warehouses cost A LOT of money but do not factor anywhere in his equations. He has even worse estimates for Water use & eWaste (disproved in the links). This employee of the Dutch central bank (no conflict of interest there then 🤔) seems to have made a career out of outlandish claims.
​
​​​Claimed Power consumption = 205 TWh/year
Hours a year = 8766
Watts = 23.4 GW
World hash (then) = 120 ExaHash
205,000 GWh / 8766 = 23.4 GW
23,400,000,000W / 120,000,000TH = 
194J/Th 
= 🤡 Utterly ridiculous !
   In 2020 the typical ASIC efficiency coming on to the market was around 29 -38 J/TH (green column) ,such as the Bitmain T19 84TH - 37.5 j/TH
Picture
   Alex also (in 2021) claimed 30,700 tonnes of e-waste every year ?!! More like 250 tonnes/year. See my calculation for Bitcoin e-Waste.

​Conclusions

  • Newer more efficient ASICs 9 - 20 J/TH will dominate the bulk of the hash rate.
  • Hash rate has increased mostly due to more efficient machines - NOT necessarily more power consumption.
  • During price rises older mining gear may be turned back on but new ASICs replace old as shelf space & power distribution are at a premium.
  • If you were the leading ASIC manufacturer (Bitmain), would you - immediately sell the golden goose - or - would you keep the superior next generation ASICs to your self for a few months ?
  • Ironically, subsidised electricity prices & grants in the US have Increased Bitcoin mining profitability and hence contributed to Bitcoins emissions.
  • Fiat money pushes energy use higher blackrock-gives-bankrupt-bitcoin-miner-core-scientific-a-new-17m-loan even Bitcoin is not immune to the fiat fire hose.
  • The existing money establishments do not like Bitcoin and will deliberately spread misinformation to put people off.
   Then there's this doozy from the World Economic Forum .They didn't even bother to take it down till 2024 🤣
aaand its back up 😂 2026
Picture

Sources

https://hashrateindex.com/blog/

F2 pool / presentation

Braiins after market control / firmware
Mining pools
  • Riot
  • Marathon
  • Iris Energy
  • Terawulf
  • Cleanspark
Hi, thanks for reading !
My goals are-
A/ Find solutions to the climate emergency (which may partly be Bitcoin).
​B/ present the most accurate assessment of Bitcoins power consumption, emissions & climate impact & continuously update & improve this website.
Please link to, retweet or send a link to friends and colleagues.
Zap Me!
Bolt 12:
More Options
Picture
Follow me on X.com
@7Bluerabbits
Picture
Follow me on Nostr via
iris.to - snort.social - Damus app - Primal
npub1l79hvcyl23f90ers7xqh7zjzmm7knj7fqf6he3lhnfyc3gfuz7lqlfsqkt
nostrplebs directory

Dissertation schreiben lassen
  • Home
  • Breakdown
  • J/THash
  • Climate
  • Water use
  • ESG
  • eWaste
  • Demand/response
  • Banking